How Perceptions Can Skew Reality: A Data Visualisation Approach
How NYC schools’ academic performance differs from public perception
--

If there is one thing this pandemic has laid bare is just how strong public perceptions are often misconstrued as reality. During the pandemic, policymakers, scientists, and news agencies have been trying to shape, change, and influence myriad public perceptions. Narratives abound, from how the pandemic started, to how it spreads, and now, how the vaccines are an important step to ending the pandemic.
Public perception can be strong, but is it rooted in reality? Do echo chambers end up perpetuating beliefs, even in the face of facts to the contrary? I became curious and decided to look into a case where there have been perception surveys and actual performance data. My goal was to see, in such an instance, how much a group of people from different backgrounds and demographics end up having similar perceptions and how closely those perceptions align with reality.
I looked into datasets that would have information on perceptions, demographics, and actual observation, to enable an analysis into the dynamics of the three. This is how I landed on a study about how parents, students, and teachers rate the learning environment in high schools across the five boroughs of New York City back in 2011. This was supplemented with information on SAT scores (gated content) for high schools within the five boroughs.
I used data visualisation to explore:
- What is the relationship between demography and school performance in NYC? Goal: Observe differences in academic performance across NYC schools’ demographics.
- What is the relationship between perceptions of academic performance and surrounding factors such as demographics and success metrics of schools? Goal: Observe how perceptions vary across demographics and if these perceptions match actual school performance.
- Are there any similarities in how survey respondents perceive the quality of NYC schools? Goal: Observe elements of echo chambers of opinions within and across groups.
A caveat on this article about the use of SAT scores to define academic performance: research has advocated for better/different means to measure how well students perform academically. This article explores how subjective perceptions can diverge from reality and remain rooted in cognate communities
The disparity in school performance between NYC Boroughs
While SATs have been questioned on their validity and reliability to accurately measure students, they can be used as a metric to compare high schools.
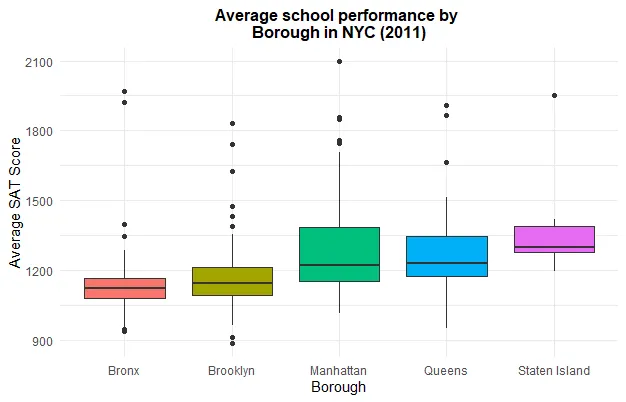
Schools in the Bronx average lower SAT scores as compared to schools in Manhattan or Staten Island. Not surprisingly, poverty rates are higher in the Bronx than Staten Island or Manhattan.

It has also been argued that SATs are inherently biased by ethnic backgrounds, social status, and cultural backgrounds. This could also explain the variance in school performance across the boroughs and socioeconomic profiles. Overall, school performance in New York City is indeed split along the demographic backgrounds and socioeconomic lines.
Diversity in schools and performance
Schools with a higher proportion of Black and Hispanic students showed lower SAT scores as compared to schools with a higher share of White and Asian students. This is in line with research that has shown how demographic and family income impact SAT scores.

Socioeconomic background of school districts has a major impact on average school performance. Schools in Staten Island and Manhattan display higher scores, better socioeconomic status and, a higher percentage of White and Asian students. This supports studies on how family income and the percentage of communities living in poverty are strong predictors of school performance.
Academic performance in schools with special programs
Schools across New York City provide a range of programs geared to help children of all backgrounds. Some of these programs include providing lunch discounts, specialized teaching, and special classes for children learning to speak English. I explored school performance trends based on the percentage of students eligible or participating in such programs.

The most significant observation is how drastically school performance drops with an increase in the number of students eligible for lunch discounts at a school. These programs are a proxy indicator to communities living in poverty. Such schools rarely have enough resources to help students perform better academically. There is a correlation between poverty and poor standardized test performance.
Creating an arbitrary cut off of 30 percent, I looked into the share of schools in each borough with at least a third of its students eligible or participating in the special programs. Again, Staten Island had the fewest schools with students enrolled in special programs, while the Bronx had the most. This matches with the socioeconomic profiles of the respective boroughs.

A correlation analysis shows how strong the relationships between racial diversity and school programs are with the academic performance of the school. When it comes to demographics, academic performance shows a strong positive correlation with the percentage of White students in a school (r= 0.65). Schools with a high percentage of White students have a negative relationship with food discounts. The strongest negative relationship is between schools with a high percentage of students eligible for food discounts and a school’s academic performance, SAT, (r= -0.72). This mirrors the socioeconomic profile of the five boroughs. Well-off boroughs (e.g., Staten Island) have better-performing schools with a more White and Asian ethnic demographic as compared to the Bronx.

Survey responses on the quality of NYC schools’ learning environments
Parents, students, and teachers submitted a total of 960,191 surveys with responses to how they rate the quality of learning environment in New York City high schools. The score/rating was was determined as a composite of four factors:
- Safety and Respect
- Communication
- Engagement
- Academic Expectations

Overall, parents seem to rate NYC schools the highest, while students (not surprisingly 😄) rate the schools lowest. Teachers show the broadest rating of NYC schools. Ratings on school performance across the four benchmarks are really close for each respondent. 50 percent of the parents, for example, rate schools between 7.47 and 8.20, a difference of just 0.72. This is an indication of how similar the perceptions of individual groups are amongst themselves.

Looking at how individual groups responded, the best rating was for safety and respect by parent respondents and the lowest was for communication by student respondents.
It is interesting to note that across each borough, the responses to the survey were somewhat similar. The box plot below shows how even the worst academically-performing borough (the Bronx) has a median rating score of 7.17, while Staten Island, which is better off academically and economically, has a median score rating of 7.30.

This could indicate how subjective the concept of “quality” is across different communities from different backgrounds. It is not easy to score/rate questions on “quality” based on subjective criteria. There will always be a wide range of results based on who responds.

Interestingly, there is very little correlation between how parents, students, and teachers rate school quality and actual school SAT performance. I would have expected SAT scores to influence how the respondents graded the quality of schools. However, their grades for engagement, safety, and communication were all highly correlated to each other. This could suggest that perceptions echo around the respondents.
Perceptions aren’t what we believe they are
What you see in the correlation matrix illustrates how respondents perceived schools on their learning environment did not have a strong correlation, nor a statistically-significant one, with actual school performance.
Actual outcomes (test scores) are not influencing perceived quality by parents, students, and teachers. Rather, it seems learning environment quality ratings are similar within individual groups, suggestive of potential information bubbles of parents, students, and teachers. This shows how perceptions can be subjective and not actually influenced by facts on a subject.
Thank you for reading! If you are interested in the version that has the R script/markdown, feel free to read it here.

Fredrick Boshe is a graduate agricultural economics researcher. He is a dog whisperer and tree hugger in his free time.